Readers of a certain age might remember Afrikaans singer Lucas Maree’s 1993 hit “Miljoen”, a song about how life’s problems could be solved with a million rand. Back then, a million rand was serious money. Adjusted for inflation, Maree would need R6.6 million today to have the same purchasing power. But even if we account for inflation, which lifts the cost of goods and service over time, but also incomes, we live in a world of very large numbers, even bigger than most people can comprehend.
A million has six digits and a billion nine. However, a trillion has 13 digits. A trillion is a million times a million and a thousand times a billion and yet is a word we read about more and more. The most striking, though short-lived, example was Elon Musk who briefly became a dollar trillionaire after the listing of SpaceX.
Richy Rich
The wealth of the world’s richest people is truly staggering. In 1916, John D Rockefeller became the first confirmed dollar billionaire. It took a hundred years for Jeff Bezos to become the first person worth $100 billion. That difference is not just inflation. In today’s money, Rockefeller would be worth around $30 billion; Bezos is genuinely richer. However, a mere 10 years after he became a centibillionaire, 20 others have joined him in this elite club, and he is no longer number one. Remarkably, Microsoft founder Bill Gates remains on this list despite donating around $60 billion to his charitable foundation, as is investor Warren Buffett, who has given away almost $70 billion.
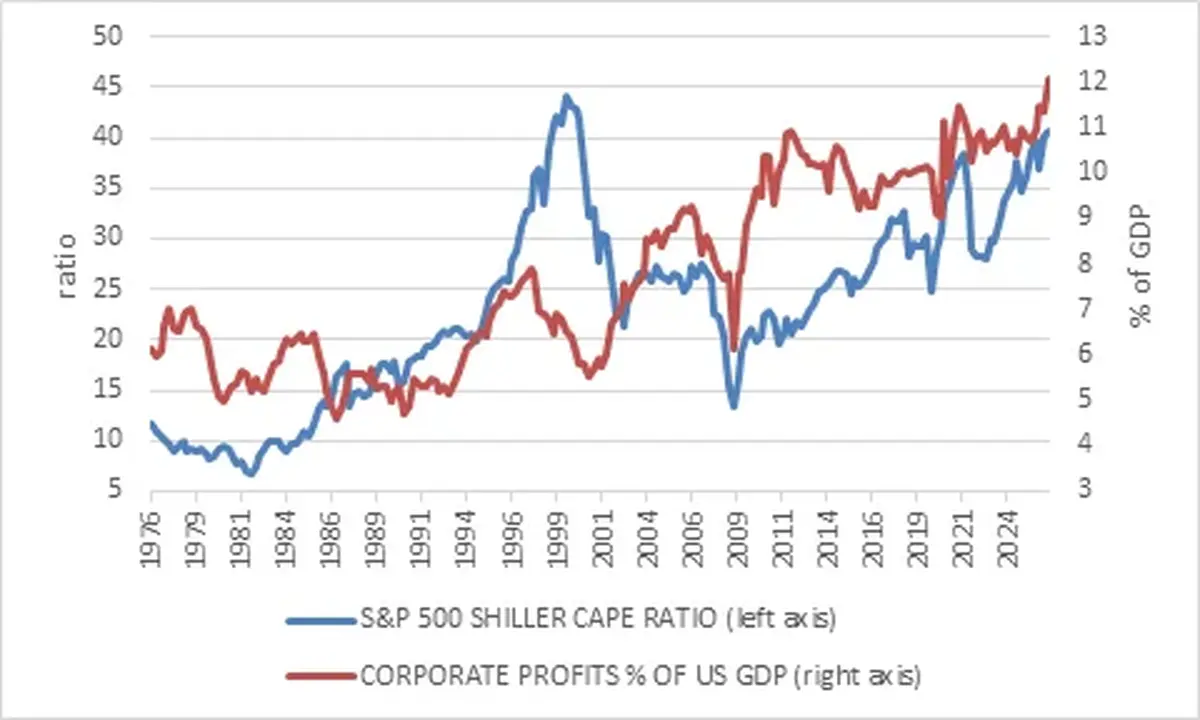
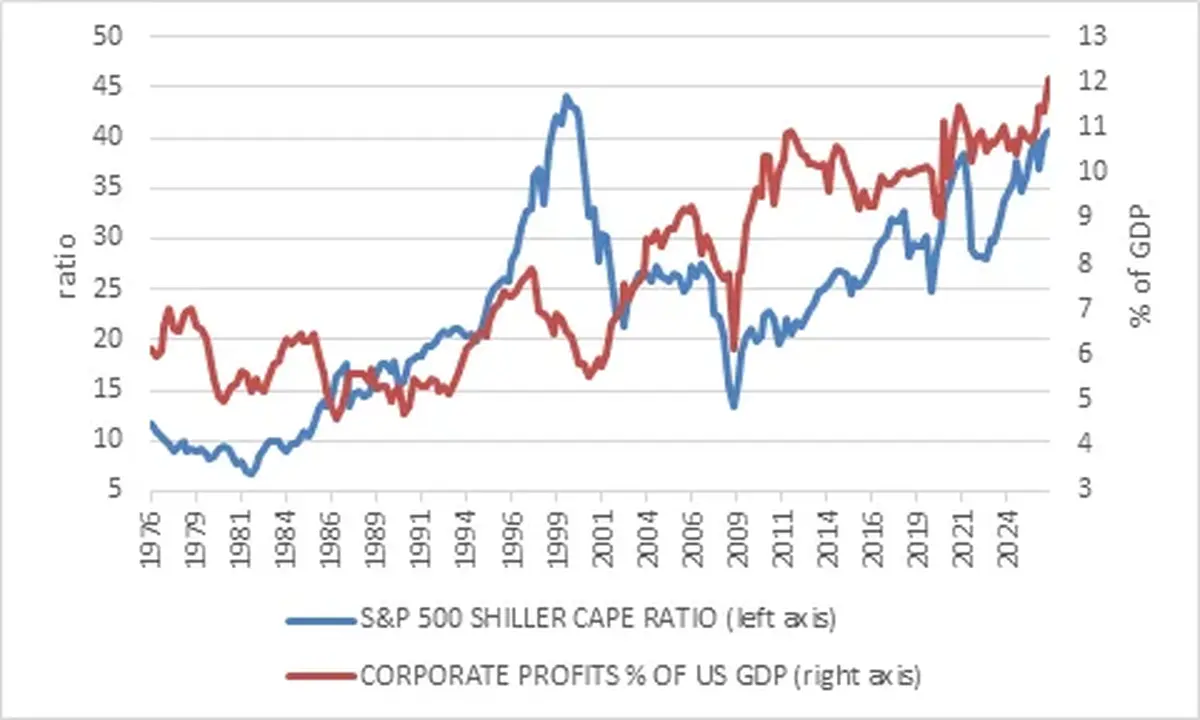
All but four of the 20 are US-based and have benefited from a long bull market in US equities. The US market has outperformed the rest of the world over the past 15 years as its companies are more profitable. However, investors are also prepared to pay more for the same dollar of sales or profits today than a decade ago. This is reflected in several metrics, such as Professor Robert Shiller’s cyclically adjusted price: earnings (CAPE) ratio shown in chart 1, which has increased steadily in recent years, reaching a lofty level.
Chart 1: US equity valuations and corporate profitability
Source: LSEG Datastream
Also shown in chart 1 is that companies’ profitability has increased relative to US national income (GDP). Companies are taking a larger share of the economic pie, implying a smaller share for workers. Much of this has to do with falling effective company tax rates from 30% in 1990 to less than 20% today in the US. Companies’ interest costs have also declined over the past few decades. But another part of the reason is the rise of new “winner-takes-all” business models. As the name suggests, some industries are dominated by one or two companies where technology, increasing returns to scale or network effects make them seemingly impervious to competition.
Apple became the first company to reach a trillion-dollar market value in 2018, amid much fanfare. It has only grown since then. Under the 15-year tenure of Tim Cook, who stepped down as CEO last week, Apple’s market capitalisation grew from $350 billion to $4.7 trillion and from a 3% weight in the S&P 500t o more than 6%. Again, that is not just inflation, since $350 billion in 2011 is $560 billion in today’s money. The growth has come from dominating its industry, including selling an estimated 3.5 billion iPhones under Cook’s leadership, while effectively managing very complex supply chains.
Today 12 other listed firms are also worth more than one trillion, depending on daily share price movements. OpenAI and Anthropic could join them if they list this year as expected. All but three of them are American, and eight can probably be characterised as “winner-takes-all” businesses. In the process, their founder-CEOs have become unimaginably rich. While shareholders have benefited greatly along the way, the increased concentration of wealth and power in the hands of a few raises deep political and social questions. A notable exception is Warren Buffett, who recently celebrated his 96th birthday. His vast fortune does not come from dominating a technological niche, but from savvy investing and the power of compounding over 85 years (he bought his first share at age 11). Compound growth remains a powerful force for turning small numbers into large ones but requires lots of time.
Returns to scale
Another area characterised by huge numbers is asset management. BlackRock became the first firm to manage $1 trillion in client money in 2009 and remains the world’s largest asset manager. It shrewdly bought the iShares business from Barclays after the global financial crisis, right about the time when index-tracking (passive investing) started growing rapidly.
Last Monday was the 50th anniversary of Vanguard’s first index-tracking fund. It failed to generate much interest at launch, missing initial sales targets by miles. But index-tracking eventually took off. Today, the fund is the world’s largest with $1.7 trillion under management and helped propel Vanguard to being the world’s second-largest manager by assets under management, with assets totalling $14 trillion. A book by financial journalist Robin Wigglesworth about Vanguard and the rise of indexation is appropriately called “Trillions”. The title doesn’t just refer to the size of these companies, but also the fees they saved investors by offering low-cost products that mimic a benchmark rather than trying to outperform it.
Drowning in debt
Part of the growth in both the value of listed companies and the asset managers is rising government debt levels. Economics nerds will refer to the Kalecki equation, an accounting identity that expresses company profits as a function of spending in the economy, including the size of the government’s budget balance. Here too, the numbers have been getting massive, contributing to the recent bond sell-off.
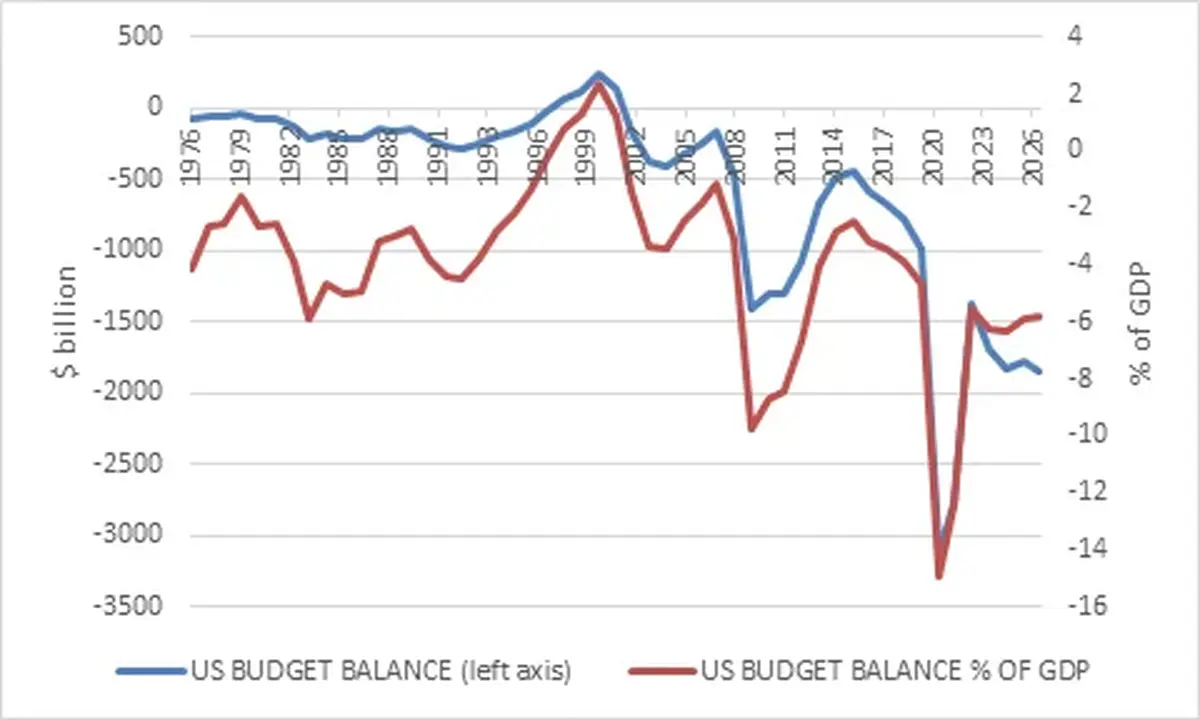
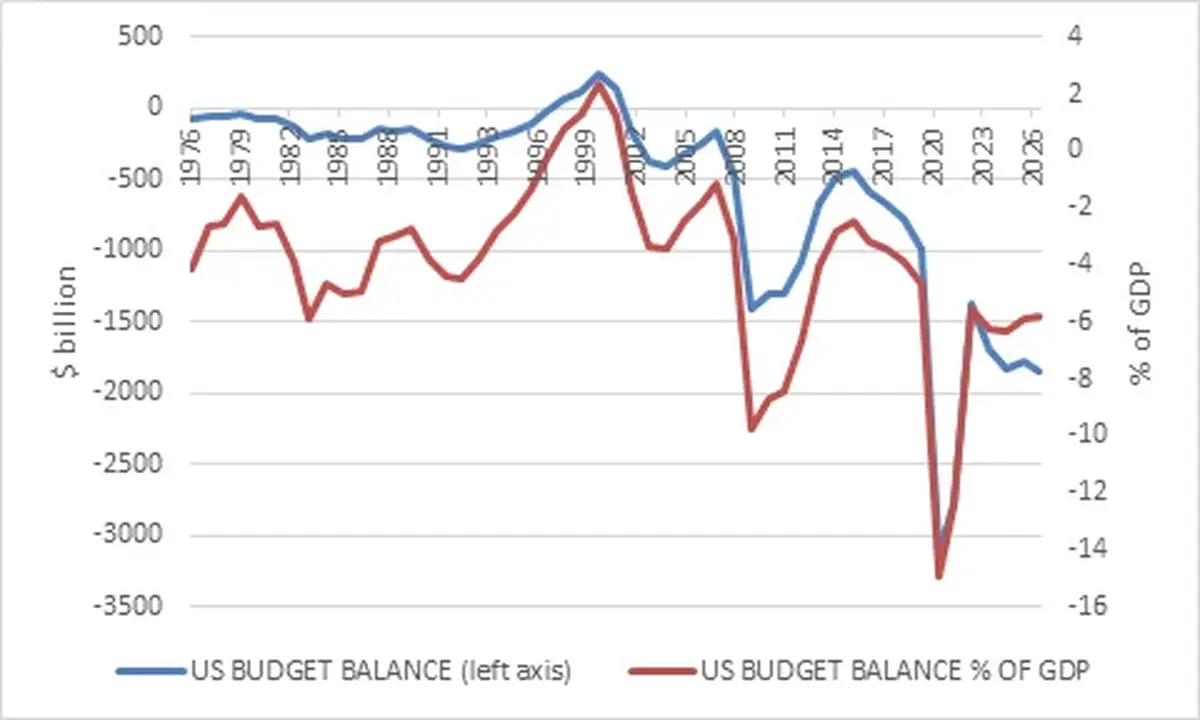
The deficit on the US federal government budget balance (difference between spending and tax revenues) first exceeded $1 trillion in 2009 in the wake of the global financial crisis. It is normal for deficits to increase in a recession, as government spending rises and tax revenues fall. The same happened when the pandemic hit, though on a bigger scale. The US deficit ballooned from $900 billion in 2019 to $3 trillion in 2020 and declined in 2021.
Chart 2: US Federal Budget Balance
Source: Congressional Budget Office
However, despite solid economic growth, it has been increasing, instead of shrinking. The 2025 tax cuts and an ageing population mean it will hit $3 trillion per year again in 2035 according to Congressional Budget Office projections. By then, about two thirds of the deficit will consist of interest payments on past borrowing. The federal government’s net interest expense will top $1 trillion for the first time this year, exceeding the national defence budget. Ten years ago, it was only $240 billion. This is not just America’s problem. Because the US is central to global financial markets, issues in the market for its government bonds can quickly spill over to the rest of the world.
The world’s factory
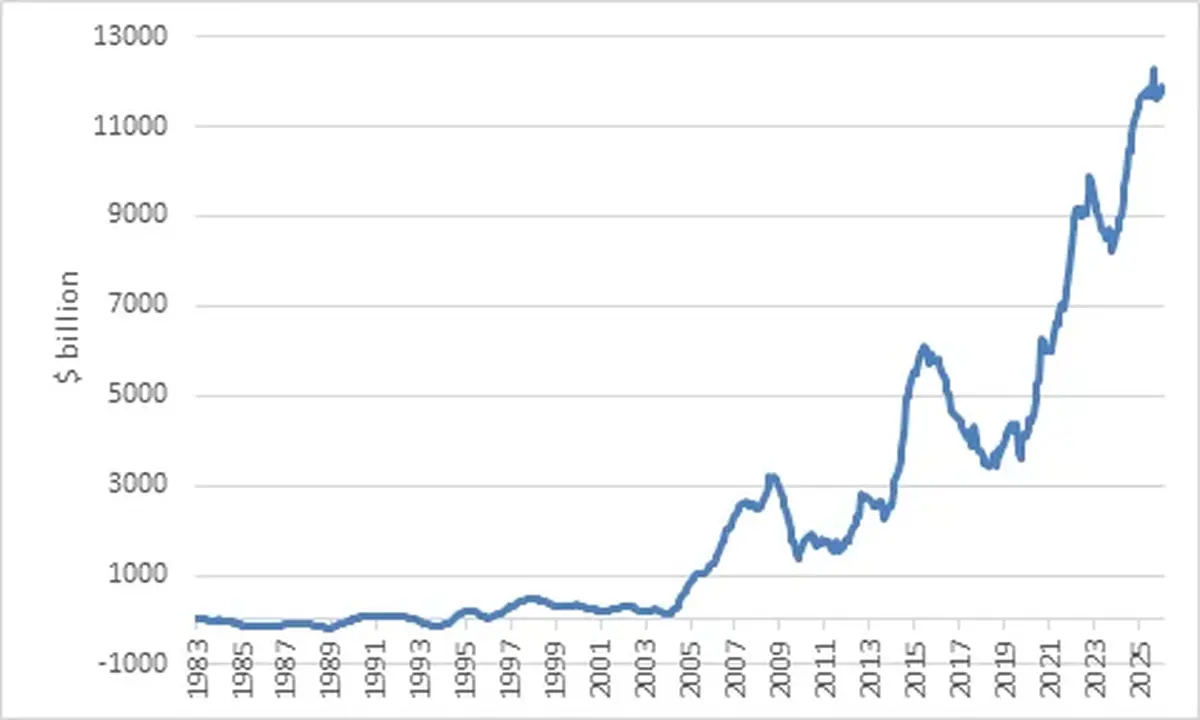
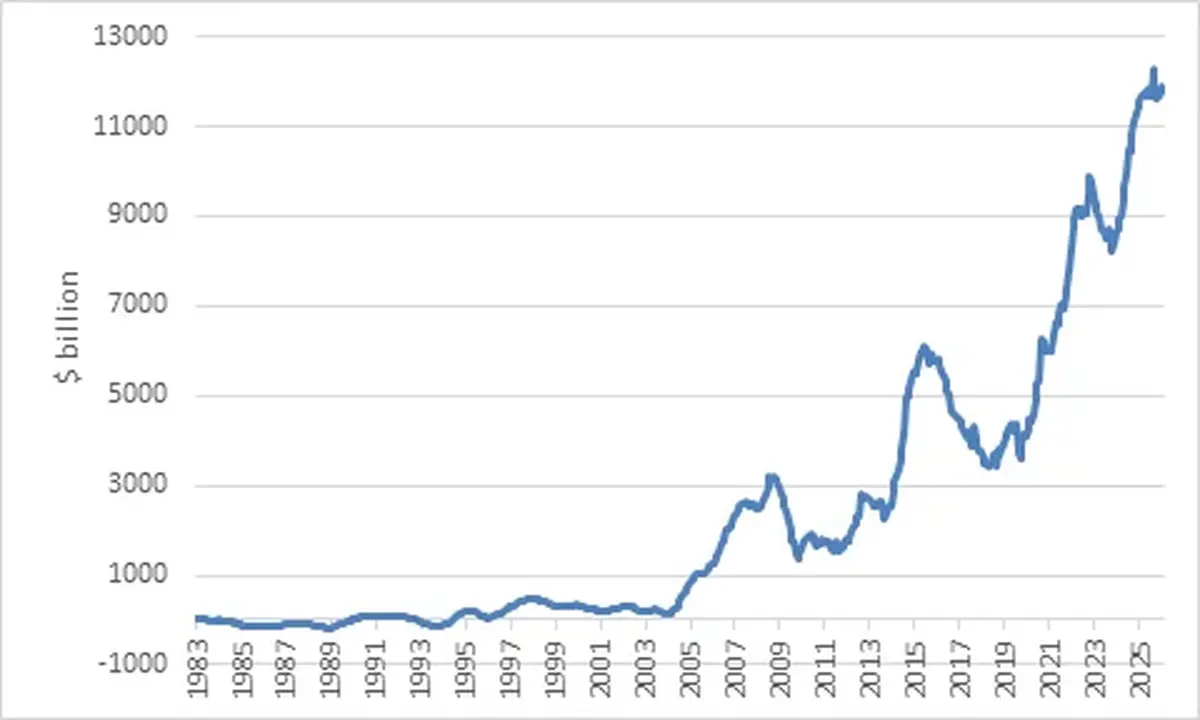
We cannot talk about big numbers without mentioning China, home to 1.4 billion people, though India is now the world’s most populous country. The relevant number here is China’s trade surplus, which hit $1 trillion last year, the first time any country had earned so much more from exports than it spent on imports. The trade surplus amounted to 4% of GDP last year, well above the long-term average of 1.5%.
One the one hand, it is a tremendous achievement. China is no longer just the biggest producer of low-cost items. It has successfully climbed up the value chain to the point where it is a major exporter of cars, high-end electronics, and everything to do with renewable energy.
On the other hand, the lack of imports reflects a deeply unbalanced domestic economy. Consumers receive a smaller share of the total pie compared to other countries, and they save a larger share of their income compared to their counterparts elsewhere. Since the real estate bubble has burst, consumers have been particularly cautious.
Chart 3: China’s trade balance, rolling 12 month sum
Source: LSEG Datastream
This surplus has long been in Donald Trump’s crosshairs, but if it continues growing, other countries could also react with trade barriers to protect domestic industries. It is therefore a source of potential instability for the global economy, much like the US government deficit (the two are linked, but that is a story for another day).
Trillions at home
Does South Africa have any notable trillions and what do these mega numbers tell local investors? Firstly, we are a small economy in the global context. The only thing that approaches the trillion-dollar mark is the JSE, with a total market cap of around $1.5 trillion. This alone tells local investors that they should broaden their horizons.
In rand terms, it is easier to get to a trillion. Old Mutual, Sanlam and Ninety One each manage more than R1 trillion for clients across various products and business lines. The PIC is by far the biggest asset manager looking after more than R3 trillion in government employees’ retirement savings. The Big Four banks each has between R1 trillion and R3.4 trillion in assets (i.e. loans to customers). SARS collected R2 trillion in tax revenue for the first time in the 2056/26 fiscal year.
South Africa’s economic output (GDP) was R 7.6 trillion in 2025, while government debt is at R5.3 trillion, or around 70% of GDP. Fifteen years ago, it was 30% of GDP. Much of the increase in borrowing was unproductive, and the economy did not grow faster because of it. Since much of the borrowing was done at high interest rates, the government now spends a fifth of tax revenues on interest payments. Unlike the US, there is a plan to stabilise debt levels and there has been some progress.
Invest with perspective
Finally, large numbers can be misleading and downright scary. This is why economists often don’t focus on raw numbers but rather express them as a share of GDP for context (as we’ve done throughout this article). Similarly, analysts will often look at companies in terms of financial ratios such as debt to equity, or interest coverage or the price: earnings ratio. Ratios allow for comparisons across time or different countries and sectors. Growth rates are another way to put large numbers into context. Something can be small today, but if it is growing rapidly, it will eventually be big. Something that is big but growing slowly will eventually be overtaken (like China’s population). And as noted right up front, it makes sense to remove the impact of inflation when comparing numbers over time.
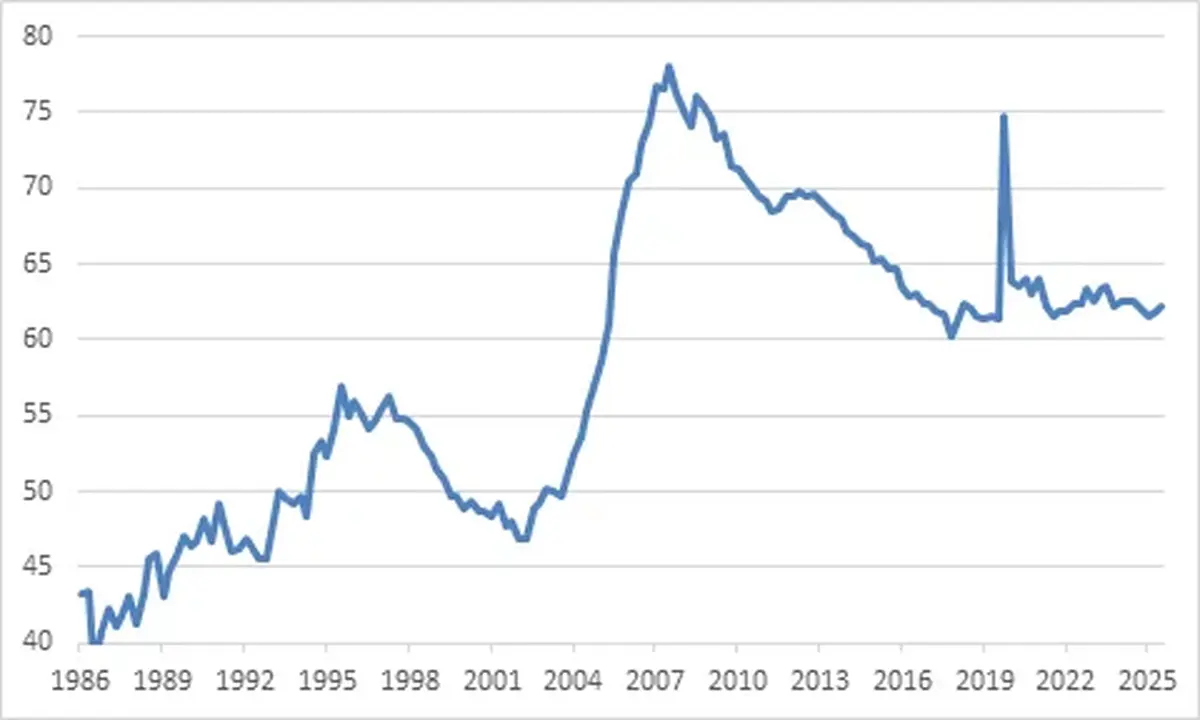
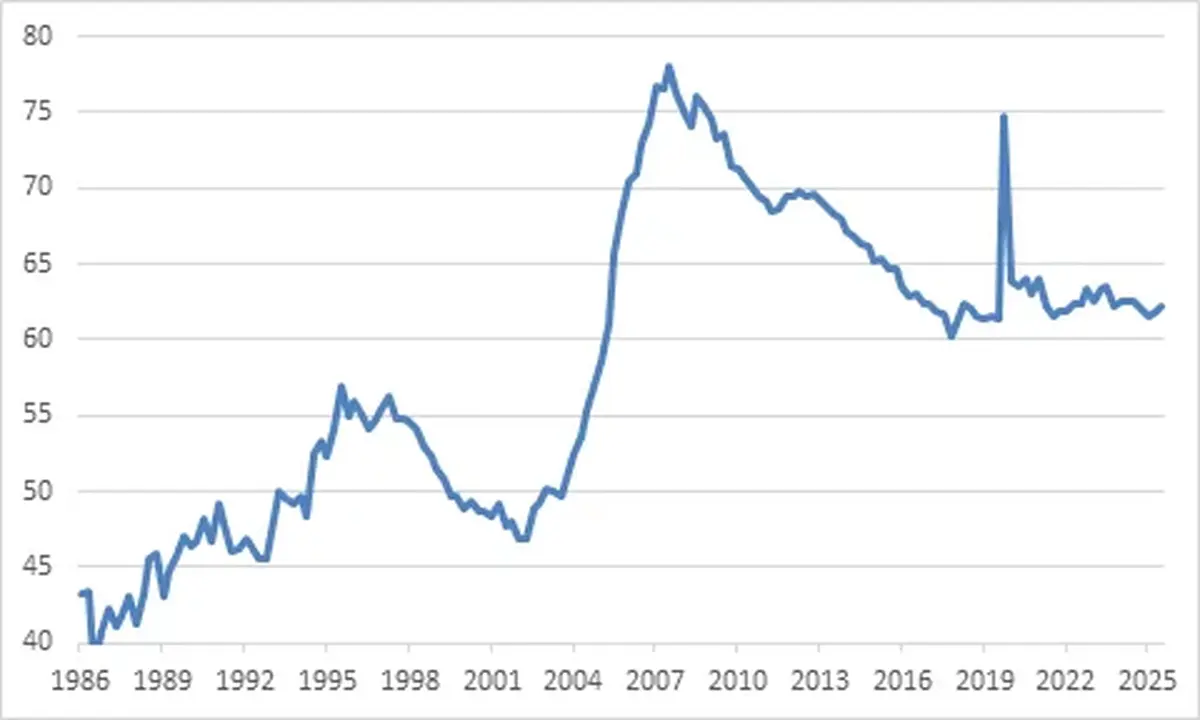
Chart 4: SA household debt as percentage of disposable income
Source: SA Reserve Bank
As an example of a big, scary number, a headline on a local news website recently read “South African households have a R2.4 trillion problem”. It referred to household debt levels, and R2.4 trillion is indeed a large number. However, it must be seen against R5 trillion in annual household disposable income. Household debt and income have grown at a similar pace over the past decade (excluding the handful of quarters around the Covid lockdowns) such that the ratio between them has been broadly stable. As chart 4 shows, it is substantially lower than the 2008 peak.
In conclusion, these large numbers tell us a lot about the state of the markets, the economy and geopolitics. In some cases, they are big not just because of the rising cost of goods and services over time, or compound growth, but because of deep changes in technology and business models. The size is also a function of what investors are prepared to pay and could reflect optimism that might turn into pessimism at some point. The obvious question is what artificial intelligence could do. Will it also be a winner-takes-all industry, in which case an Anthropic or OpenAI could become the first $10 trillion company, or does AI become a commodity, more like electricity. Either way, it remains important that we always put large and small numbers into the right perspective to avoid uninformed investment decisions.
A million has six digits and a billion nine. However, a trillion has 13 digits. A trillion is a million times a million and a thousand times a billion and yet is a word we read about more and more. The most striking, though short-lived, example was Elon Musk who briefly became a dollar trillionaire after the listing of SpaceX.
Richy Rich
The wealth of the world’s richest people is truly staggering. In 1916, John D Rockefeller became the first confirmed dollar billionaire. It took a hundred years for Jeff Bezos to become the first person worth $100 billion. That difference is not just inflation. In today’s money, Rockefeller would be worth around $30 billion; Bezos is genuinely richer. However, a mere 10 years after he became a centibillionaire, 20 others have joined him in this elite club, and he is no longer number one. Remarkably, Microsoft founder Bill Gates remains on this list despite donating around $60 billion to his charitable foundation, as is investor Warren Buffett, who has given away almost $70 billion.
All but four of the 20 are US-based and have benefited from a long bull market in US equities. The US market has outperformed the rest of the world over the past 15 years as its companies are more profitable. However, investors are also prepared to pay more for the same dollar of sales or profits today than a decade ago. This is reflected in several metrics, such as Professor Robert Shiller’s cyclically adjusted price: earnings (CAPE) ratio shown in chart 1, which has increased steadily in recent years, reaching a lofty level.
Chart 1: US equity valuations and corporate profitability
Source: LSEG Datastream
Also shown in chart 1 is that companies’ profitability has increased relative to US national income (GDP). Companies are taking a larger share of the economic pie, implying a smaller share for workers. Much of this has to do with falling effective company tax rates from 30% in 1990 to less than 20% today in the US. Companies’ interest costs have also declined over the past few decades. But another part of the reason is the rise of new “winner-takes-all” business models. As the name suggests, some industries are dominated by one or two companies where technology, increasing returns to scale or network effects make them seemingly impervious to competition.
Apple became the first company to reach a trillion-dollar market value in 2018, amid much fanfare. It has only grown since then. Under the 15-year tenure of Tim Cook, who stepped down as CEO last week, Apple’s market capitalisation grew from $350 billion to $4.7 trillion and from a 3% weight in the S&P 500t o more than 6%. Again, that is not just inflation, since $350 billion in 2011 is $560 billion in today’s money. The growth has come from dominating its industry, including selling an estimated 3.5 billion iPhones under Cook’s leadership, while effectively managing very complex supply chains.
Today 12 other listed firms are also worth more than one trillion, depending on daily share price movements. OpenAI and Anthropic could join them if they list this year as expected. All but three of them are American, and eight can probably be characterised as “winner-takes-all” businesses. In the process, their founder-CEOs have become unimaginably rich. While shareholders have benefited greatly along the way, the increased concentration of wealth and power in the hands of a few raises deep political and social questions. A notable exception is Warren Buffett, who recently celebrated his 96th birthday. His vast fortune does not come from dominating a technological niche, but from savvy investing and the power of compounding over 85 years (he bought his first share at age 11). Compound growth remains a powerful force for turning small numbers into large ones but requires lots of time.
Returns to scale
Another area characterised by huge numbers is asset management. BlackRock became the first firm to manage $1 trillion in client money in 2009 and remains the world’s largest asset manager. It shrewdly bought the iShares business from Barclays after the global financial crisis, right about the time when index-tracking (passive investing) started growing rapidly.
Last Monday was the 50th anniversary of Vanguard’s first index-tracking fund. It failed to generate much interest at launch, missing initial sales targets by miles. But index-tracking eventually took off. Today, the fund is the world’s largest with $1.7 trillion under management and helped propel Vanguard to being the world’s second-largest manager by assets under management, with assets totalling $14 trillion. A book by financial journalist Robin Wigglesworth about Vanguard and the rise of indexation is appropriately called “Trillions”. The title doesn’t just refer to the size of these companies, but also the fees they saved investors by offering low-cost products that mimic a benchmark rather than trying to outperform it.
Drowning in debt
Part of the growth in both the value of listed companies and the asset managers is rising government debt levels. Economics nerds will refer to the Kalecki equation, an accounting identity that expresses company profits as a function of spending in the economy, including the size of the government’s budget balance. Here too, the numbers have been getting massive, contributing to the recent bond sell-off.
The deficit on the US federal government budget balance (difference between spending and tax revenues) first exceeded $1 trillion in 2009 in the wake of the global financial crisis. It is normal for deficits to increase in a recession, as government spending rises and tax revenues fall. The same happened when the pandemic hit, though on a bigger scale. The US deficit ballooned from $900 billion in 2019 to $3 trillion in 2020 and declined in 2021.
Chart 2: US Federal Budget Balance
Source: Congressional Budget Office
However, despite solid economic growth, it has been increasing, instead of shrinking. The 2025 tax cuts and an ageing population mean it will hit $3 trillion per year again in 2035 according to Congressional Budget Office projections. By then, about two thirds of the deficit will consist of interest payments on past borrowing. The federal government’s net interest expense will top $1 trillion for the first time this year, exceeding the national defence budget. Ten years ago, it was only $240 billion. This is not just America’s problem. Because the US is central to global financial markets, issues in the market for its government bonds can quickly spill over to the rest of the world.
The world’s factory
We cannot talk about big numbers without mentioning China, home to 1.4 billion people, though India is now the world’s most populous country. The relevant number here is China’s trade surplus, which hit $1 trillion last year, the first time any country had earned so much more from exports than it spent on imports. The trade surplus amounted to 4% of GDP last year, well above the long-term average of 1.5%.
One the one hand, it is a tremendous achievement. China is no longer just the biggest producer of low-cost items. It has successfully climbed up the value chain to the point where it is a major exporter of cars, high-end electronics, and everything to do with renewable energy.
On the other hand, the lack of imports reflects a deeply unbalanced domestic economy. Consumers receive a smaller share of the total pie compared to other countries, and they save a larger share of their income compared to their counterparts elsewhere. Since the real estate bubble has burst, consumers have been particularly cautious.
Chart 3: China’s trade balance, rolling 12 month sum
Source: LSEG Datastream
This surplus has long been in Donald Trump’s crosshairs, but if it continues growing, other countries could also react with trade barriers to protect domestic industries. It is therefore a source of potential instability for the global economy, much like the US government deficit (the two are linked, but that is a story for another day).
Trillions at home
Does South Africa have any notable trillions and what do these mega numbers tell local investors? Firstly, we are a small economy in the global context. The only thing that approaches the trillion-dollar mark is the JSE, with a total market cap of around $1.5 trillion. This alone tells local investors that they should broaden their horizons.
In rand terms, it is easier to get to a trillion. Old Mutual, Sanlam and Ninety One each manage more than R1 trillion for clients across various products and business lines. The PIC is by far the biggest asset manager looking after more than R3 trillion in government employees’ retirement savings. The Big Four banks each has between R1 trillion and R3.4 trillion in assets (i.e. loans to customers). SARS collected R2 trillion in tax revenue for the first time in the 2056/26 fiscal year.
South Africa’s economic output (GDP) was R 7.6 trillion in 2025, while government debt is at R5.3 trillion, or around 70% of GDP. Fifteen years ago, it was 30% of GDP. Much of the increase in borrowing was unproductive, and the economy did not grow faster because of it. Since much of the borrowing was done at high interest rates, the government now spends a fifth of tax revenues on interest payments. Unlike the US, there is a plan to stabilise debt levels and there has been some progress.
Invest with perspective
Finally, large numbers can be misleading and downright scary. This is why economists often don’t focus on raw numbers but rather express them as a share of GDP for context (as we’ve done throughout this article). Similarly, analysts will often look at companies in terms of financial ratios such as debt to equity, or interest coverage or the price: earnings ratio. Ratios allow for comparisons across time or different countries and sectors. Growth rates are another way to put large numbers into context. Something can be small today, but if it is growing rapidly, it will eventually be big. Something that is big but growing slowly will eventually be overtaken (like China’s population). And as noted right up front, it makes sense to remove the impact of inflation when comparing numbers over time.
Chart 4: SA household debt as percentage of disposable income
Source: SA Reserve Bank
As an example of a big, scary number, a headline on a local news website recently read “South African households have a R2.4 trillion problem”. It referred to household debt levels, and R2.4 trillion is indeed a large number. However, it must be seen against R5 trillion in annual household disposable income. Household debt and income have grown at a similar pace over the past decade (excluding the handful of quarters around the Covid lockdowns) such that the ratio between them has been broadly stable. As chart 4 shows, it is substantially lower than the 2008 peak.
In conclusion, these large numbers tell us a lot about the state of the markets, the economy and geopolitics. In some cases, they are big not just because of the rising cost of goods and services over time, or compound growth, but because of deep changes in technology and business models. The size is also a function of what investors are prepared to pay and could reflect optimism that might turn into pessimism at some point. The obvious question is what artificial intelligence could do. Will it also be a winner-takes-all industry, in which case an Anthropic or OpenAI could become the first $10 trillion company, or does AI become a commodity, more like electricity. Either way, it remains important that we always put large and small numbers into the right perspective to avoid uninformed investment decisions.
Subscribe to our free newsletter
Stay at the forefront of financial advisory excellence with MoneyMarketing's weekly insights. As a professional adviser, you'll receive carefully curated content that enhances your practice and client relationships without cluttering your inbox. Our commitment to delivering only relevant, actionable intelligence helps you make informed decisions that drive your business forward. Join our community of leading financial professionals today and transform your practice with our complimentary newsletter—because your success is our priority.